


Trading asset. Trading asset on which the vfxAlert signal appeared.
About vfxAlert signals
vfxAlert application is the best instrument for the binary options trading. In one window together with platform the trader will find the full-range of analytical instruments: direct binary signals, online-charts, trend indicator, market news and signals history.
vfxAlert has an intuitive interface that provides convenience for both novice traders and professionals.
There are two ways of working with vfxAlert:
create your own strategy using the signals supplied by this application
use an adaptive algorithm for signal confirmation according to an already existing strategy.
Signal structure
To work with signals correctly, you need to understand their structure. The signal looks like this.

01

02


03

04

05

06

07

08
1.
2.
Price. Quote when the
signal has appeared.
3.
Time. Time since the
appearance of the signal.
4.
Expiration. Recommended time
of option’s expiration.
5.
Algorithm. Algorithm used
for the signal’s searching;
6.
Signal. Option type — CALL (buy)/PUT (sell).
7.
Power. Signal power. The percentage of profitable tradesbased on the current indicator data. Signal power displays data for a trading asset (indicator 1) for one timeframe.
8.
Heatmap. Heatmap. Power of the current trend or reversal. Determined by statistics and indicators for the current timeframe. Displays data for indicator 2 in one timeframe.
Power & Heatmaps
It is a statistical data of successfully completed signals. Power shows statistical data for current indicator #1 value by one timeframe.


Heatmaps show data for current indicator #2 value on each timeframe.
To calculated statistics data we use completed signals from our database. We can see how indicator’s values in different trading sessions influence signals winning percent.
To make a decision, you should analyze the signal strength and heat maps. For the analysis of heat maps, it is sufficient to analyze the values of the nearest periods relative to the expiration time of the signal. For an expiration time of 1 minute — analyze the values on M1 M5 — necessarily, M15 — desirable. M30, H1, H4 — can be ignored.
For expiration time 5 — analyze M5, M15, M30 — necessarily, M1, H1, H4 — can be ignored, and so on.
Signal algorithms
Signals are generated based on data from four standard technical analysis indicators. They are included in the basic set of all popular trading terminals.
Moving Average (MA)
- CALL - Fast MA(5) crossing Slows MA(17) from up to down.
- PUT -Fast MA(5) crossing Slows MA(17) from down to up.
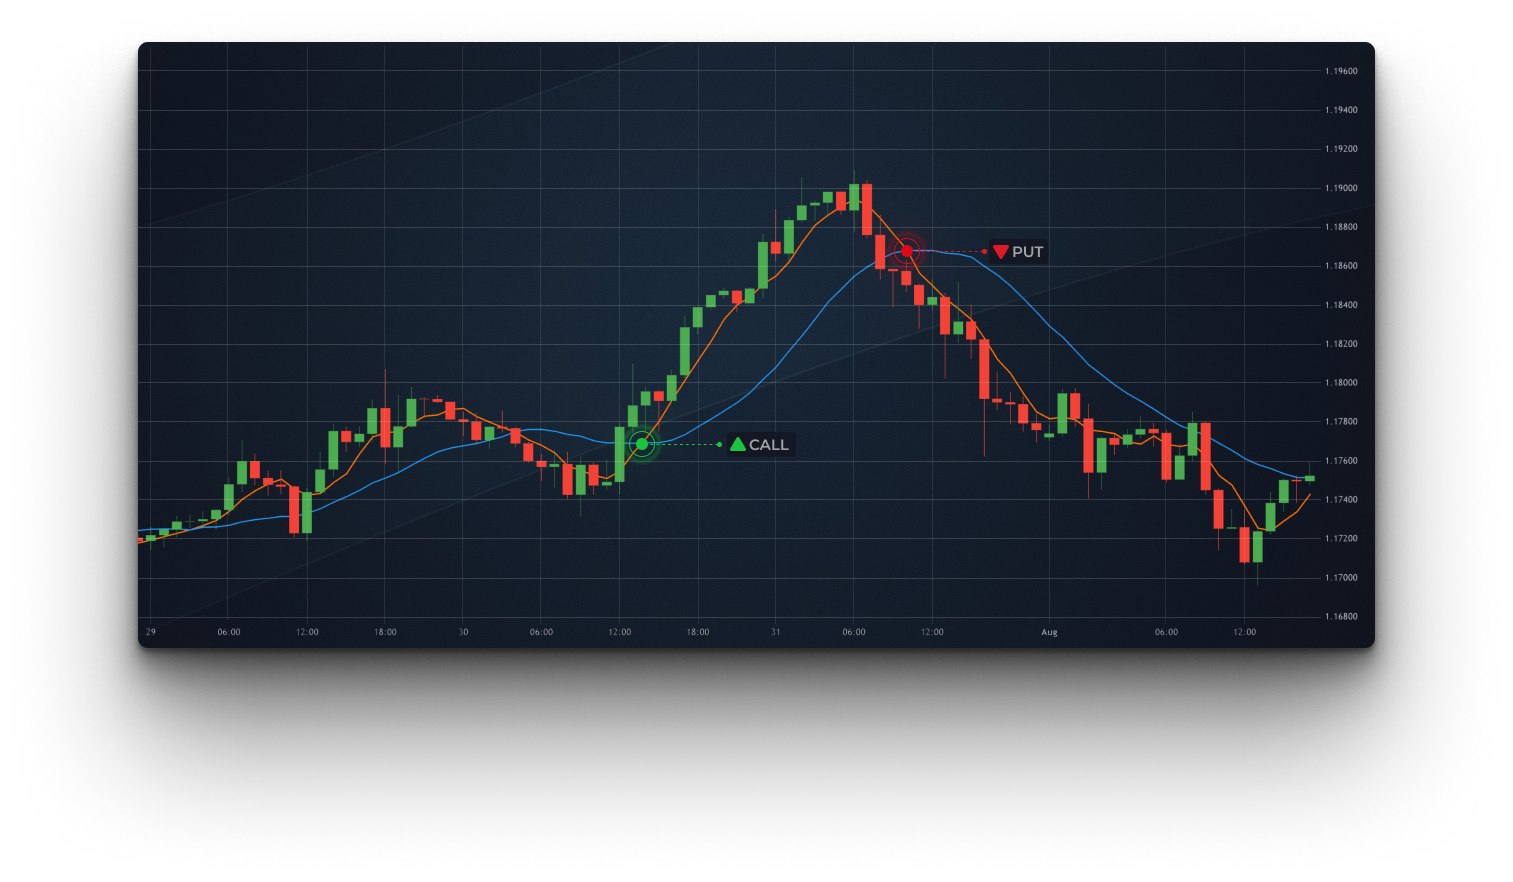
The task of this indicator is to remove the market «noise» as much as possible and to show the actual direction of the trend. The indicator line is a dynamic support/resistance level, which can be used to determine not only the opening point of the option but also the approximate expiration term. They are considered one of the determinants of the price direction for all trading assets, including cryptocurrencies. When the price moves above the MA, the trend is considered ascending, respectively, if it is lower, then it is a downtrend. When the market moves sideways, the indicator line goes horizontally.
The signals will be at the classic intersection points «fast» and «slow» SMA. In the figure, there is a starting point of an uptrend and you can open a CALL-option, respectively, for PUT-option the opposite conditions — the red «fast» crosses the blue «slow» from top to bottom. The signal power increases if there is an intersection on several timeframes.
Parabolic SAR (P-SAR)
- CALL -at least 7 preview values under price & current value above price.
- PUT -at least 7 preview values above price & current value above price.
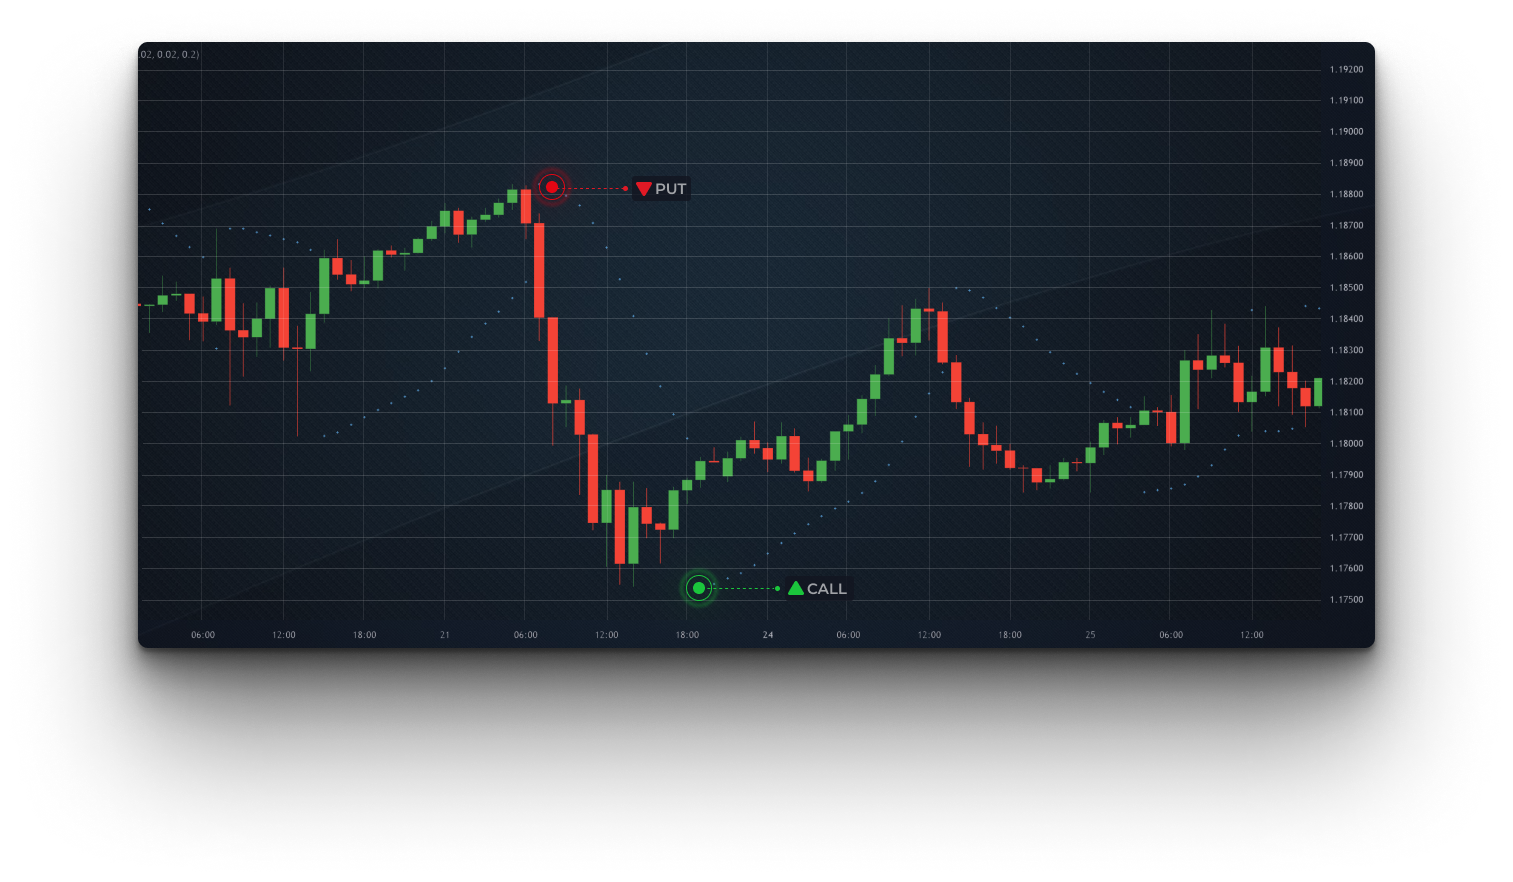
A trend indicator designed to identify trend reversal points. Parabolic SAR follows a strong trend, even if there are local pullbacks and corrections. Farther the indicator points are from the price, the stronger is the movement and the fewer are the false signals. Thus, the closer to the price chart, the faster the reversal will occur.
Use P-SAR with standard settings and working out: points move below the price chart, look for an entry point for CALL-option, open PUT-option above.
Commodity Channel
Index (CCI)
Index (CCI)
- CALL - crossing 0 level from 100.
- PUT - crossing 0 level from - 100.

It is used on any assets to determine the beginning and end of a trend in terms of time and amplitude.
Trading is carried out at the intersection of the zero level: from bottom to top for an up option (CALL) and from top to bottom for a down option (PUT). An obligatory condition for the appearance of a signal: before opening a trade, the previous 7 CCI values must be below the zero level for the CALL-option and above for the PUT (see figure). The signal power increases if the indicator leaves the +/- 100 zones during this interval.
Regardless of the signal’s work, it is necessary to monitor changes in the dynamics of market volumes, including peak ones. In combination with CCI, they can give leading signals.
Relative Strength
Index (RSI)
Index (RSI)
- CALL - crossing 30 level from down to up.
- PUT - crossing 70 level from up to down.
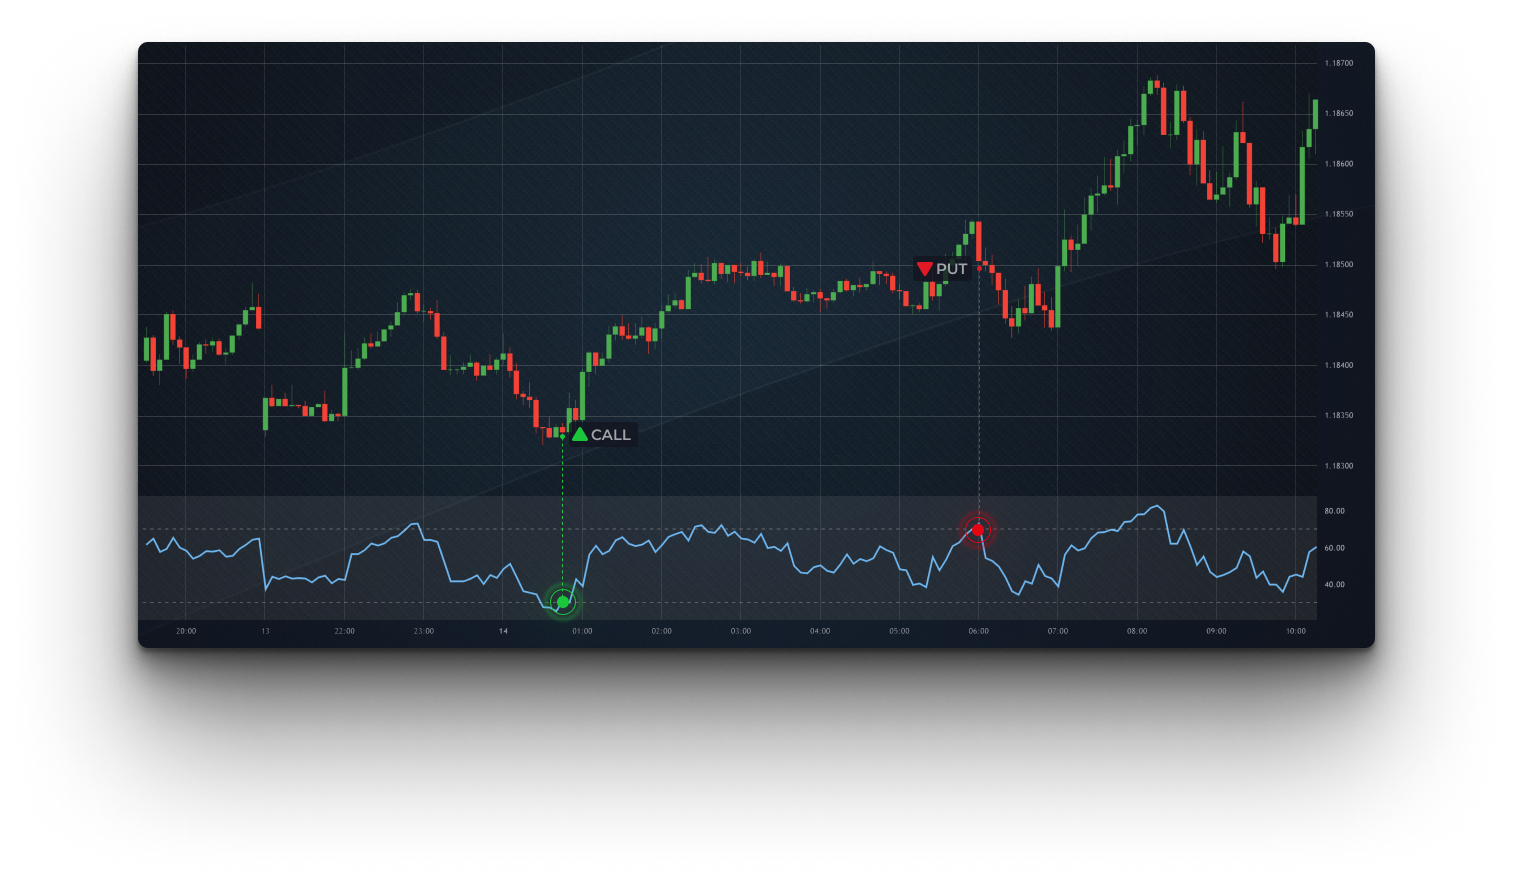
The task of this oscillator is to find the moment when it is necessary, if possible, to close the current trades and start looking for entry points into a new trend. Its algorithm calculates the percentage for a specified number of periods between «long» buy price bars and "short" sell price bars. In other words, overbought/oversold periods are found.
Exit from the oversold zone and an upward movement of the indicator will be a signal for CALL-option, opposite conditions (from overbought and down) are for PUT-option. To confirm the signal, you can additionally put an indicator with numerous periods on the chart in the binary trading platform, for example (12) and standard (14). Then the “faster” vfxAlert will stay ahead, and the trader then makes the final decision on the rest of the RSI.
additional indicators
Algorithm. If you are already using the indicator from the list in your strategy, it might be better not to duplicate the information and use the rest as additional confirmation;
Power. Scalpers can trade all opportunities, while more "moderate" traders are better off leaving only the strongest signals;
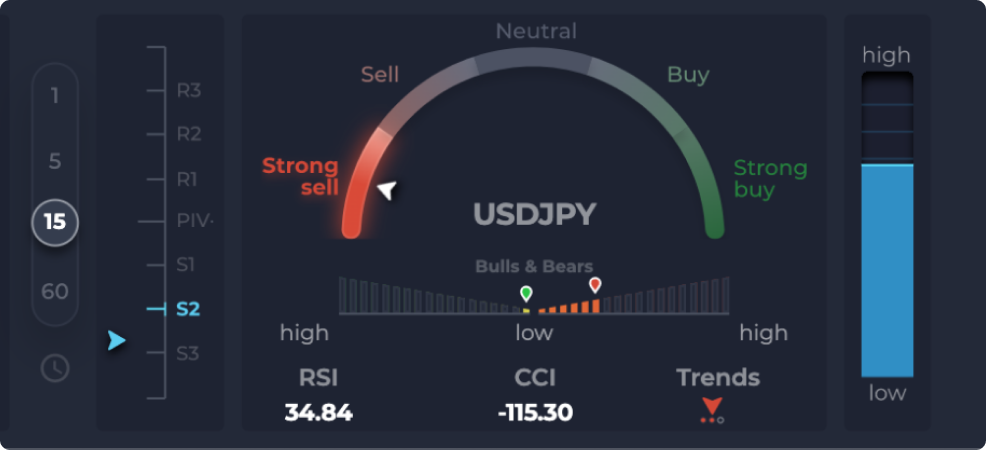
Timeframe. The time interval for which the forecast is made. Periods of 1, 5, 15, and 60 minutes are available.
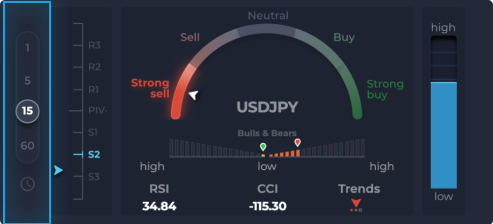
Pivot Points. Along with Fibonacci, one of the most popular price levels, the breakout of which confirms the continuation of the trend, and the rebound confirms the reversal. The levels are recalculated at the beginning of the trading day and then do not change.
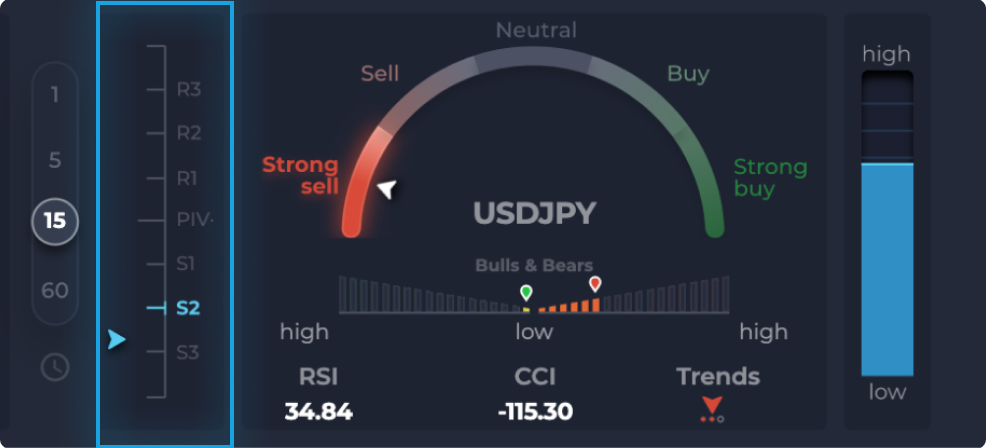
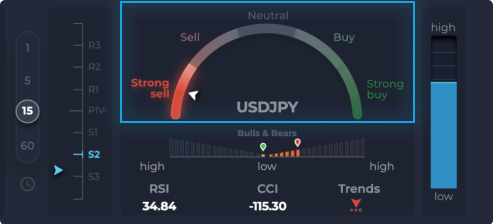
Summary. Information about the current market sentiment in form of a scale. The «warmer» corresponding parts of the indicator, the stronger signal: green for CALL-option, red for a PUT-option.
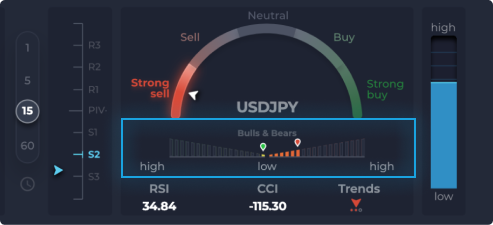
Bulls&Bears. The colored scale that represents the calculation of power for bulls (buyers) and bears (sellers). The more colored points are on a certain part, the stronger are the corresponding market participants.
RSI. Trend indicators must necessarily be confirmed by at least one oscillator indicating an overbought when buyers can no longer move the price up, or oversold where there is almost no one in the market to sell at lower prices.
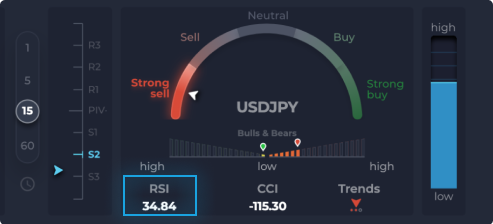
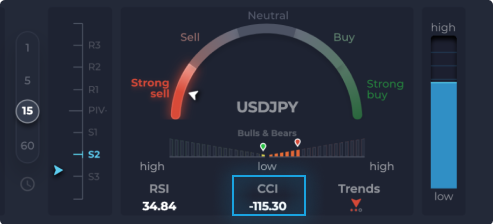
CCI. Commodity Channel Index. This oscillator shows the dynamics of price movement or how fast the current trend is growing or ending.
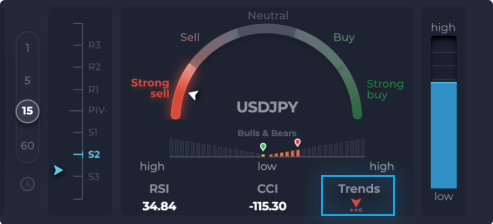
Trends. This indicator works by Moving Average and shows where the market can go for the next 10-15 bars of the selected timeframe. If the arrow points up, this signalizes about the coming uptrend, if it points down — about the coming downtrend. The quantity of colored dots under the arrow indicates the power of the current trend.
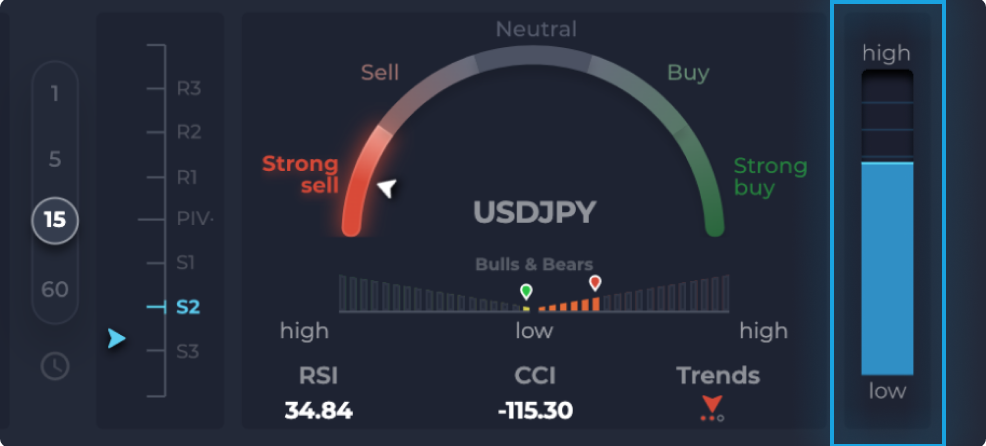
Volatility. Current market activity — the higher it is, the greater the likelihood of frequent price reversals, on which binary options work well.

Also people ask
Where I can find examples of signals?
Read this article to find examples of signals https://blog.vfxalert.com/en/t/signal-and-strategies-examples Here you will see the description of different signals and the recommendation for further actions.
Do vfxAlert signals work in my country?
Yes, vfxAlert signals work in any country. We are an international company that aims to be available for traders from over the world. If you want to check the work of signals, open the Free account, run the application and you will see, how the signals appear in your browser window.
Do you guarantee the results?
vfxAlert offers signals and real-time statistics depending on current indicators values. Signals are the result of market analysis on a particular algorithm, a trader has to understand how signals are formed. vfxAlert signals serve only to confirm the trader's personal strategy.
How to choose the broker?
If you want to know how to choose the broker’s platform, read our article https://blog.vfxalert.com/en/t/how-to-choose-a-binary-options-broker. Here you will find the information about the main criteria according to which it is necessary to select the broker. You can choose one of the basic brokers which are presented in the Free account of vfxAlert. Also, you can add the local broker from your country.
How to choose the trading strategy?
Please, read our article to find out why it is so important to have your own unique strategy https://blog.vfxalert.com/en/t/trading-strategy
If you don't know where to start, please read other articles on strategies on our blog https://blog.vfxalert.com/en/strategies